Stats that Matter
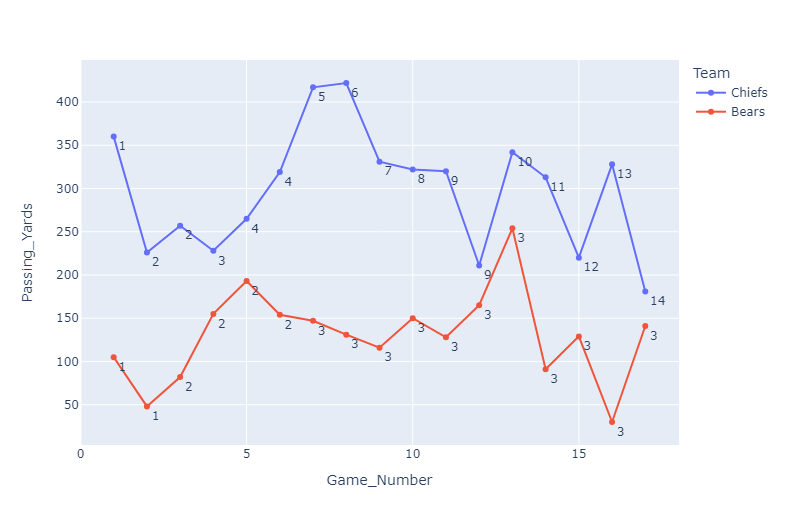
In our analysis of statistics from the 2022 NFL Season, we identified a number of statistics that we deemed more indicative of success for a team throughout the year. One of the statistics that we identified as more indicative of success is a team's conversion rate in the redzone. When teams score touchdowns in the redzone, they score 7 points instead of 3, and that teams are more successful at that have more success. Below we have compared the redzone efficiency (total touchdowns by redzone opportunities), of the four best teams and the four worst teams. As you will see, there is a huge discrepency. Another important statistics was passing yards. Teams that were effective in throwing the football were more successful in terms of win total.
Redzone Efficiency
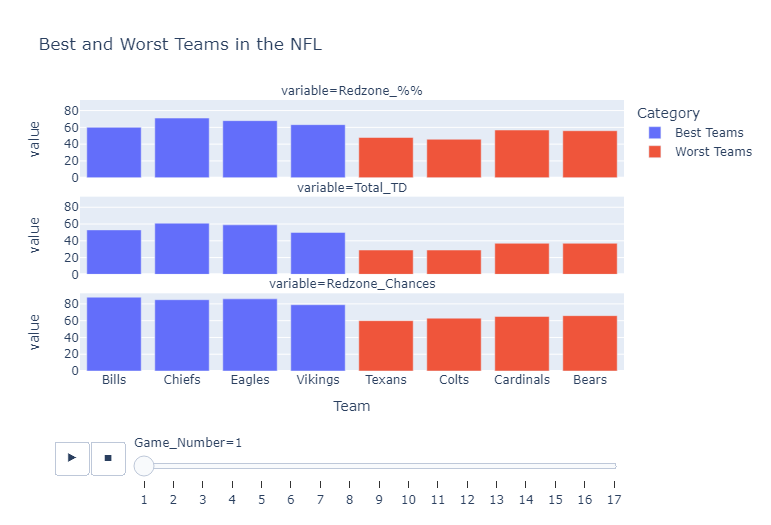
The best teams in the NFL (shown in blue on the left of this graph) have a significant amount more in every category (Redzone Conversion Rate, Total Redzone Touchdowns, and Redzone Chances).